Side by side
The 257, the 143, and all 400
A sampling of the socio-demographic data for the 257 anonymous American female converts who responded to both the quantitative and qualitative sections, the 143 anonymous American female converts who responded to the quantitative questions only, and the two groups combined. Every block carries a Total row and a data table so the counts can be added up and checked.
Screening: are you an American convert to Islam?
Denominators · 257 · 143 · combined 400 · The first of the two screening questions
| The 257 | The 143 | All 400 | |
|---|---|---|---|
| Yes | 100%n=257 | 100%n=143 | 100%n=400 |
| No | 0%n=0 | 0%n=0 | 0%n=0 |
| Total | 100%n=257 | 100%n=143 | 100%n=400 |
Note
Every woman counted anywhere on this page answered yes. Nobody who answered no appears in either cohort.
Screening: gender
Denominators · 257 · 143 · combined 400 · The second of the two screening questions
| The 257 | The 143 | All 400 | |
|---|---|---|---|
| Female | 100%n=257 | 100%n=143 | 100%n=400 |
| Male | 0%n=0 | 0%n=0 | 0%n=0 |
| Total | 100%n=257 | 100%n=143 | 100%n=400 |
Note
Both cohorts are entirely female. Together with the question above, this is what makes the two groups directly comparable and the combined 400 column legitimate: the same population, screened by the same two questions, differing only in how much of the survey they completed.
Marital status at the time of conversion
Denominators · 257 · 143 · combined 400 · All categories shown
| The 257 | The 143 | All 400 | |
|---|---|---|---|
| Single, never married | 55%n=141 | 55%n=79 | 55%n=220 |
| Single with children | 5%n=13 | 10%n=14 | 6.8%n=27 |
| Engaged | 4%n=11 | 4%n=6 | 4.3%n=17 |
| Married without children | 7%n=18 | 8%n=11 | 7.2%n=29 |
| Married with children | 9%n=23 | 8%n=11 | 8.5%n=34 |
| Divorced | 9%n=22 | 8%n=12 | 8.5%n=34 |
| Divorced with children | 9%n=23 | 6%n=8 | 7.8%n=31 |
| Separated | 2%n=6 | 1%n=1 | 1.8%n=7 |
| Widowed | 0%n=0 | 1%n=1 | 0.3%n=1 |
| Total | 100%n=257 | 100%n=143 | 100%n=400 |
Note
Taking every status that is not a marriage together (single never married, single with children, divorced, divorced with children, separated): 205 of the 257 (79.8%), 114 of the 143 (79.7%), and 319 of the 400 (79.8%). All three cohorts land on the same figure, and it is this count of 319 women that stands behind the study’s 80% finding.
Current marital status
Denominators · 257 · 143 · combined 400 · At the time of the survey
| The 257 | The 143 | All 400 | |
|---|---|---|---|
| Single, never married | 14%n=35 | 18%n=26 | 15.3%n=61 |
| Single with children | 3%n=8 | 5%n=7 | 3.8%n=15 |
| Engaged | 4%n=10 | 5%n=7 | 4.3%n=17 |
| Married without children | 18%n=46 | 15%n=22 | 17%n=68 |
| Married with children | 39%n=101 | 37%n=53 | 38.5%n=154 |
| Divorced | 10.5%n=27 | 8%n=12 | 9.8%n=39 |
| Divorced with children | 10%n=26 | 8%n=12 | 9.5%n=38 |
| Separated | 0.75%n=2 | 1%n=1 | 0.8%n=3 |
| Widowed | 0.75%n=2 | 2%n=3 | 1.3%n=5 |
| Total | 100%n=257 | 100%n=143 | 100%n=400 |
Note
Taking both married categories together, 147 of the 257 (57.2%), 75 of the 143 (52.4%), and 222 of the 400 (55.5%) were married at the time of the survey. Set against the status at conversion above, where 55% were single and never married, this is the clearest movement in the dataset: these women largely came to Islam unmarried and married afterward.
Race and ethnicity
Denominators · 257 · 143 · combined 400 · Self-identified, open-ended, quantified by hand
| The 257 | The 143 | All 400 | |
|---|---|---|---|
| Caucasian or White | 53%n=136 | 50%n=71 | 51.7%n=207 |
| African American or Black | 20%n=51 | 19%n=27 | 19.5%n=78 |
| Hispanic or Latina | 7%n=17 | 13%n=19 | 9%n=36 |
| 2+ races or ethnicities | 14%n=37 | 8%n=12 | 12.3%n=49 |
| Asian | 2%n=6 | 2%n=3 | 2.3%n=9 |
| Native American | 0.4%n=1 | 2%n=3 | 1%n=4 |
| Other | 4%n=9 | 6%n=8 | 4.3%n=17 |
| Total | 100%n=257 | 100%n=143 | 100%n=400 |
Note
2+ races or ethnicities and Hispanic or Latina move in opposite directions by almost the same amount, and in both cohorts the two categories together total exactly 21%. Because both were quantified by hand from open-ended, self-identified answers, the likeliest explanation is a coding boundary drawn slightly differently between the two passes, not a genuine difference between the women.
Age at the time of conversion
Denominators · 257 · 143 · combined 400 · All categories shown
| The 257 | The 143 | All 400 | |
|---|---|---|---|
| Less than 16 | 2%n=6 | 1%n=2 | 2%n=8 |
| 16 to 19 | 16%n=42 | 14%n=20 | 15.5%n=62 |
| 20 to 24 | 28%n=72 | 34%n=49 | 30.3%n=121 |
| 25 to 34 | 35%n=90 | 34%n=49 | 34.8%n=139 |
| 35 to 44 | 10%n=26 | 9%n=13 | 9.8%n=39 |
| 45 to 54 | 5%n=12 | 6%n=9 | 5.3%n=21 |
| 55 to 64 | 3%n=8 | 1%n=1 | 2.3%n=9 |
| 65 or over | 0.4%n=1 | 0%n=0 | 0.3%n=1 |
| Total | 100%n=257 | 100%n=143 | 100%n=400 |
Note
Across the full sample, 330 of the 400 (82.5%) took their shahāda before the age of 35.
Belief prior to conversion to Islam
Denominators · 257 · 143 · combined 400 · Self-identified, open-ended, quantified by hand
| The 257 | The 143 | All 400 | |
|---|---|---|---|
| Christian | 76.3%n=196 | 68.5%n=98 | 73.5%n=294 |
| Agnostic | 5%n=13 | 11.9%n=17 | 7.5%n=30 |
| Atheist | 2.7%n=7 | 2.8%n=4 | 2.8%n=11 |
| Buddhist | 1.2%n=3 | 0%n=0 | 0.8%n=3 |
| Jewish | 3.9%n=10 | 1.4%n=2 | 3%n=12 |
| None | 3.9%n=10 | 4.9%n=7 | 4.3%n=17 |
| Other | 7%n=18 | 10.5%n=15 | 8.3%n=33 |
| Total | 100%n=257 | 100%n=143 | 100%n=400 |
Note
Christianity is by far the most common starting point: 294 of the 400 (73.5%), rising to 306 (76.5%) from an Abrahamic tradition once the twelve former Jewish respondents are counted. A meaningful minority arrived from no religious commitment at all: taking agnostic, atheist, and none together, 58 of the 400 (14.5%). This is also the item where the two cohorts diverge most. Agnostic is more than twice as common among the 143 (11.9% against 5%), with Christian correspondingly lower (68.5% against 76.3%), so the 143 arrived from a somewhat less churched starting point.
Branches of Christianity prior to conversion
Denominators · 257 · 143 · combined 294 · The former Christians only · 257 group n=196 · 143 group n=98
| The 257 | The 143 | All 400 | |
|---|---|---|---|
| Protestant | 63.26%n=124 | 62%n=61 | 62.9%n=185 |
| Roman Catholic | 29.6%n=58 | 32%n=31 | 30.3%n=89 |
| Anglican | 2.55%n=5 | 0%n=0 | 1.7%n=5 |
| Mormon | 1.53%n=3 | 2%n=2 | 1.7%n=5 |
| Jehovah's Witness | 0.51%n=1 | 1%n=1 | 0.7%n=2 |
| Seventh Day Adventist | 1.02%n=2 | 0%n=0 | 0.7%n=2 |
| Unitarian Universalist | 1.53%n=3 | 3%n=3 | 2%n=6 |
| Total | 100%n=196 | 100%n=98 | 100%n=294 |
Note
Protestant and Roman Catholic backgrounds account for almost the whole picture: 274 of the 294 former Christians (93.2%) came from one or the other. Protestant alone is 185 (62.9%) and Roman Catholic 89 (30.3%), and the two cohorts agree closely on both. Every remaining branch is in single figures.
Branches of Islam
Denominators · 257 · 143 · combined 400 · All categories shown
| The 257 | The 143 | All 400 | |
|---|---|---|---|
| Sunni | 51.75%n=133 | 63%n=90 | 55.8%n=223 |
| Sunni-Sufi | 11.28%n=29 | 9.8%n=14 | 10.8%n=43 |
| Sufi | 10.5%n=27 | 3.5%n=5 | 8%n=32 |
| Shiʿa | 6.25%n=16 | 3.5%n=5 | 5.3%n=21 |
| Shiʿa-Sunni | 1.55%n=4 | 0%n=0 | 1%n=4 |
| Shiʿa-Sufi | 1.55%n=4 | 0.7%n=1 | 1.3%n=5 |
| Shiʿa-Sunni-Sufi | 0.77%n=2 | 0.7%n=1 | 0.8%n=3 |
| Nation of Islam | 2.33%n=6 | 2.8%n=4 | 2.5%n=10 |
| Nation of Islam-Sunni | 0.77%n=2 | 0%n=0 | 0.5%n=2 |
| Other | 13.25%n=34 | 16%n=23 | 14.2%n=57 |
| Total | 100%n=257 | 100%n=143 | 100%n=400 |
Note
All Sunni-inclusive categories together: 66.1% of the 257 (n=170), 73.4% of the 143 (n=105), and 68.8% of the 400 (n=275). All Sufi-inclusive categories together: 24.1% of the 257 (n=62), 14.7% of the 143 (n=21), and 20.8% of the 400 (n=83).
Highest level of education completed
Denominators · 257 · 143 · combined 400 · All categories shown
| The 257 | The 143 | All 400 | |
|---|---|---|---|
| K-8th | 0%n=0 | 0%n=0 | 0%n=0 |
| Some high school | 0%n=0 | 0.7%n=1 | 0.3%n=1 |
| High School / GED | 5%n=13 | 7%n=10 | 5.8%n=23 |
| Some college | 16%n=42 | 19.5%n=28 | 17.5%n=70 |
| Trade school | 6%n=15 | 7%n=10 | 6.3%n=25 |
| A.A. / A.S. | 11%n=29 | 9.8%n=14 | 10.8%n=43 |
| B.A. / B.S. | 32%n=81 | 33.5%n=48 | 32.3%n=129 |
| M.A. / M.S. | 26%n=68 | 19%n=27 | 23.8%n=95 |
| Ph.D. | 4%n=9 | 3.5%n=5 | 3.5%n=14 |
| Total | 100%n=257 | 100%n=143 | 100%n=400 |
Note
These are highly educated women. Across the full sample, 95 of the 400 (23.8%) hold a master’s degree and 14 (3.5%) hold a doctorate, so 109 (27.3%) hold a graduate degree. Another 129 (32.3%) hold a bachelor’s, bringing those with a bachelor’s or higher to 238 of the 400 (59.5%). Add the 43 (10.8%) holding an associate’s degree and 281 of the 400 (70.3%) hold an associate’s degree or higher, with a further 70 (17.5%) having completed some college.
Length of time as a Muslim
Denominators · 257 · 143 · combined 400 · At the time of the survey
| The 257 | The 143 | All 400 | |
|---|---|---|---|
| 0 to 3 years | 25%n=66 | 31%n=45 | 27.8%n=111 |
| 4 to 7 years | 22%n=56 | 27%n=38 | 23.5%n=94 |
| 8 to 11 years | 13%n=33 | 10%n=15 | 12%n=48 |
| 12 to 15 years | 14%n=36 | 14%n=20 | 14%n=56 |
| 16 to 19 years | 8%n=20 | 4%n=6 | 6.5%n=26 |
| 20+ years | 18%n=46 | 13%n=19 | 16.3%n=65 |
| Total | 100%n=257 | 100%n=143 | 100%n=400 |
Note
Across the full sample, 205 of the 400 (51.3%) were within their first seven years as a Muslim when they answered.
Geographic reach
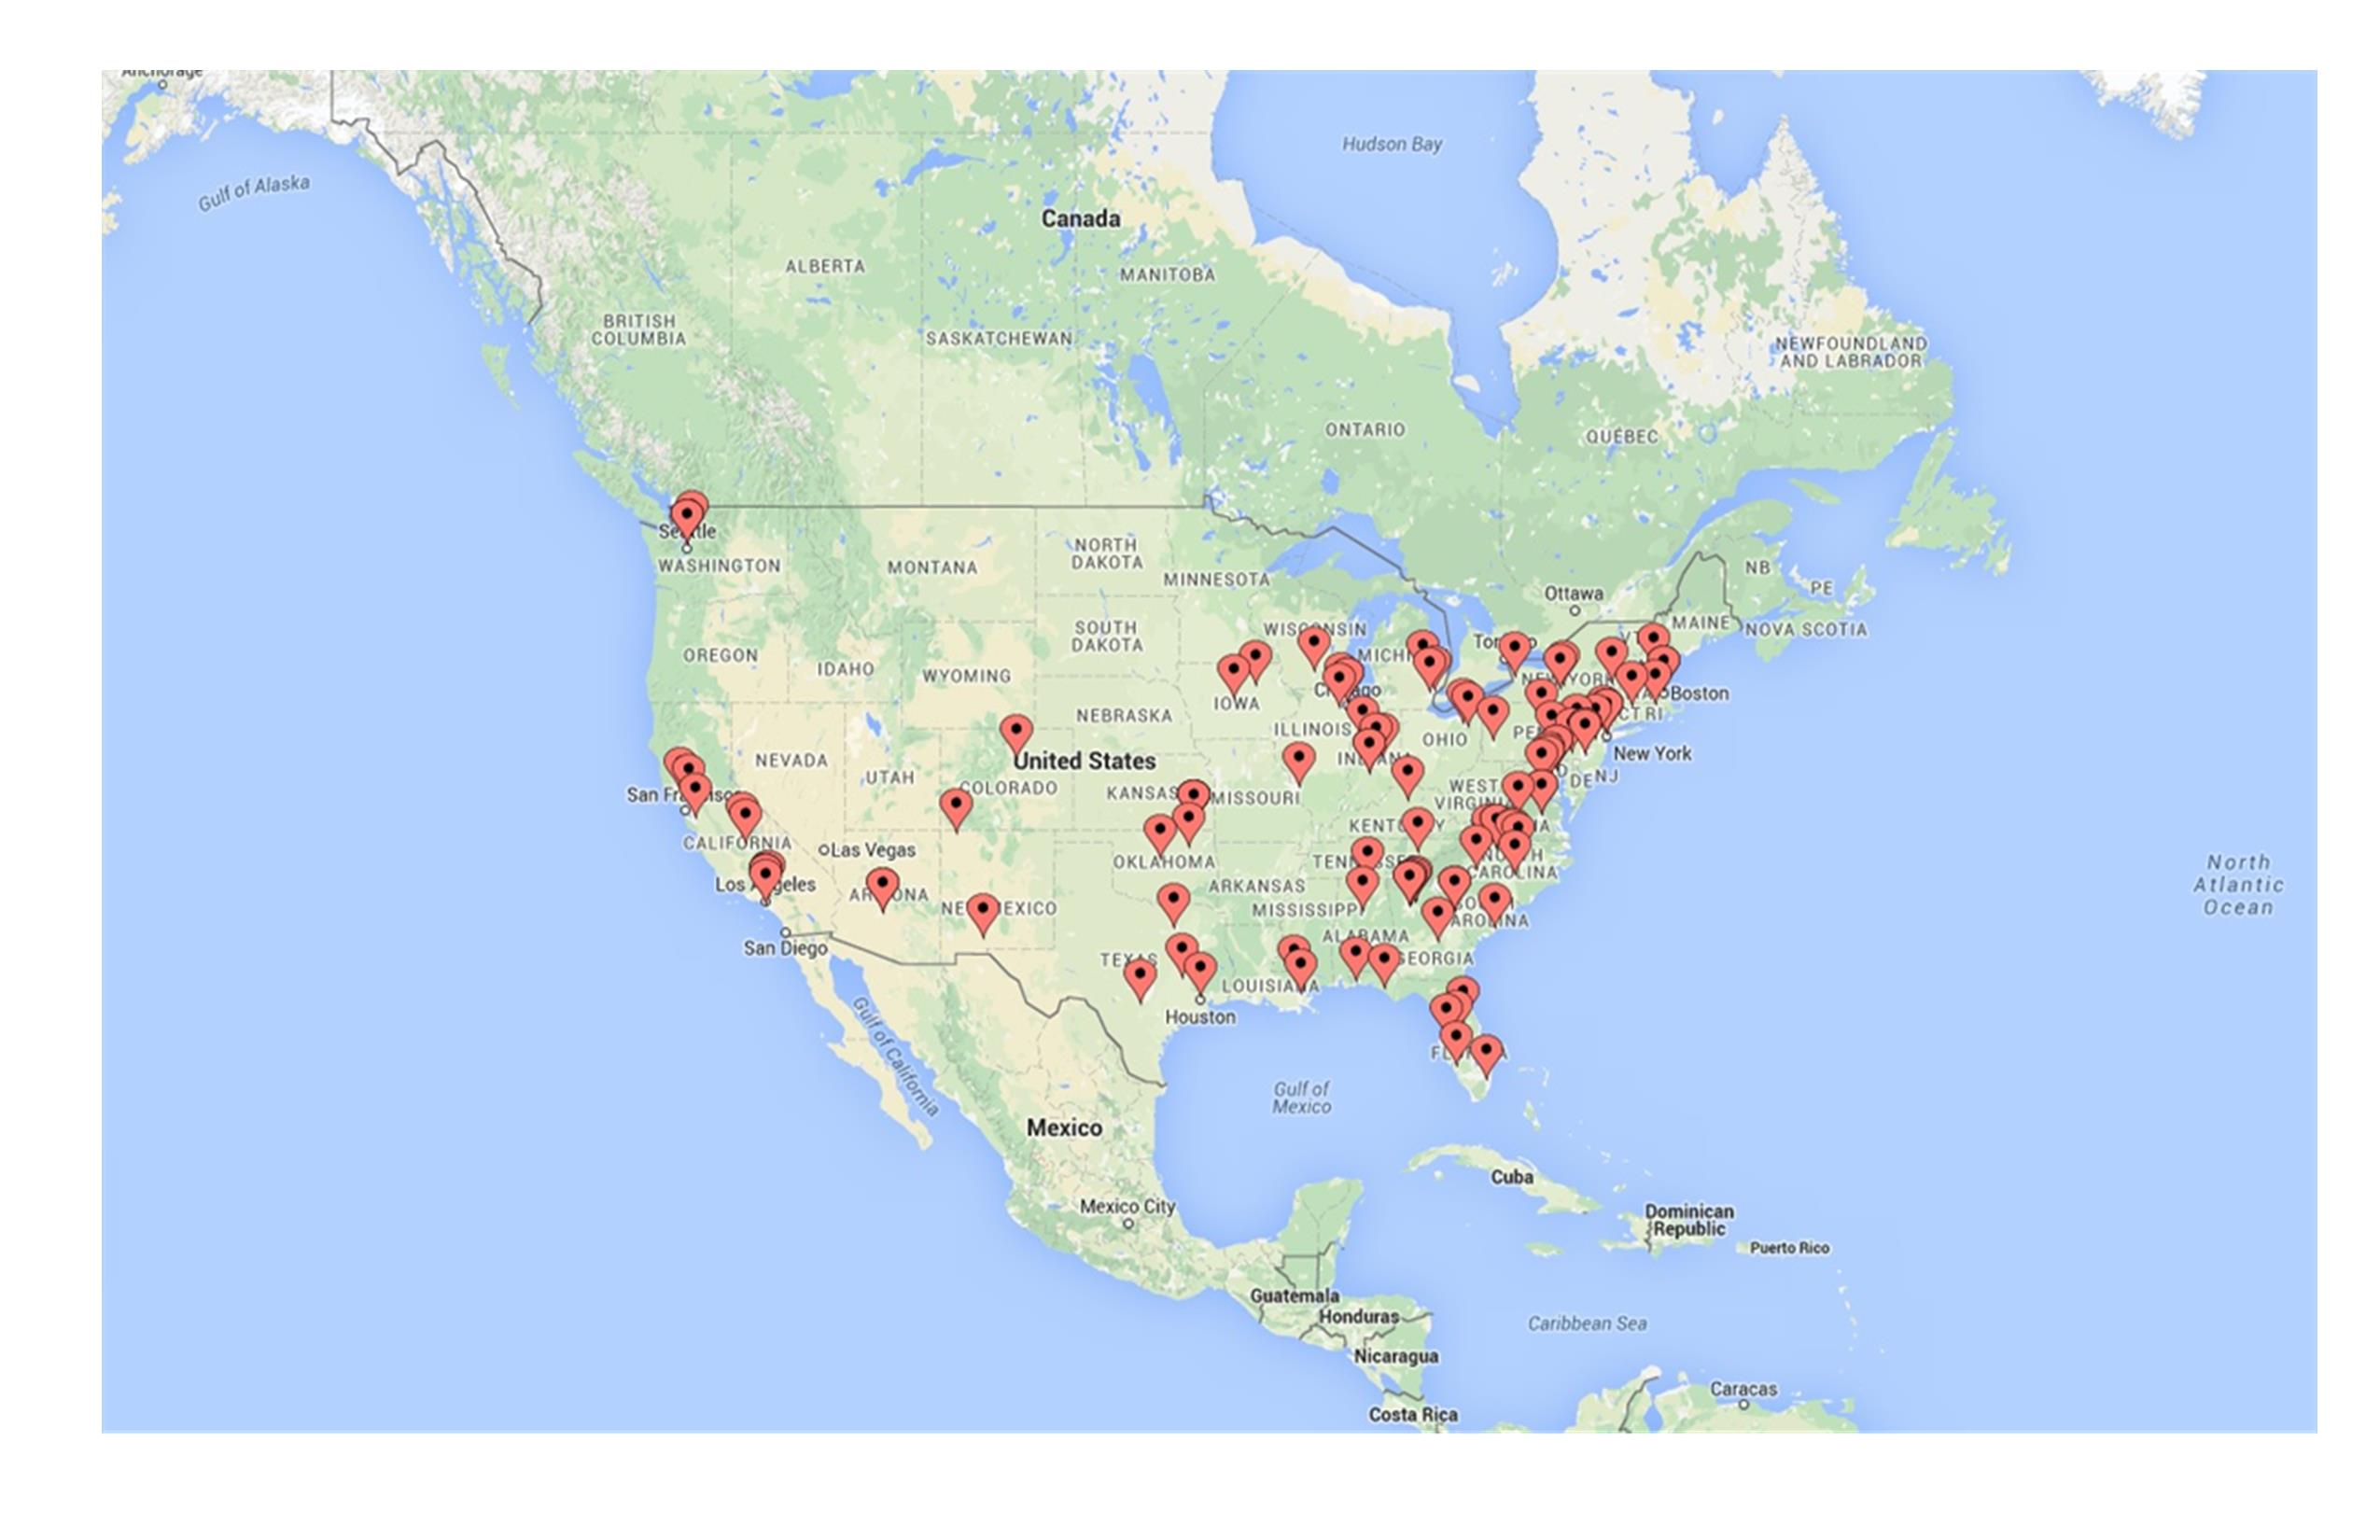
The 143 · respondent locations across the United States
Note
The 143 wrote in from across the continental United States, concentrated in the Northeast, Mid-Atlantic, Southeast, Great Lakes region, and California, with representation in the Mountain West, Pacific Northwest, and Southwest. The geographic reach of the 257 is mapped on the Demographics page. The two maps are presented separately because the source charts plot locations rather than counts, so no paired percentage can be given.
How to read this
Across marital status, age at conversion, education, and the broad shape of prior religious background, the two groups track closely, often within a point or two. Single, never married at conversion is identical at 55%. Caucasian or White (53% and 50%), African American or Black (20% and 19%), Asian (2% and 2%), Atheist (2.7% and 2.8%), and Ph.D. (4% and 3.5%) are all nearly interchangeable. That similarity is the finding: two groups who chose different levels of participation nevertheless describe the same population.
Four differences deserve naming honestly rather than smoothing over. Agnostic before conversion is more than twice as common among the 143 (11.9% against 5%), while Christian is correspondingly lower (68.5% against 76.3%), so the 143 arrived from a somewhat less churched starting point. The 143 also skew newer to Islam (31% within their first three years, against 25%) and report Sunni affiliation more often (63% against 51.8%). Each is plausible if the women who stopped before the long qualitative questions were, on average, earlier in a journey they had less language for yet. Those are hypotheses, not conclusions, and they are exactly the questions a follow-up study can answer.
The apparent gap in Hispanic or Latina and 2+ races or ethnicities is treated separately above; the two categories sum to 21% in both cohorts, which points to a hand-coding boundary rather than a difference between the women.